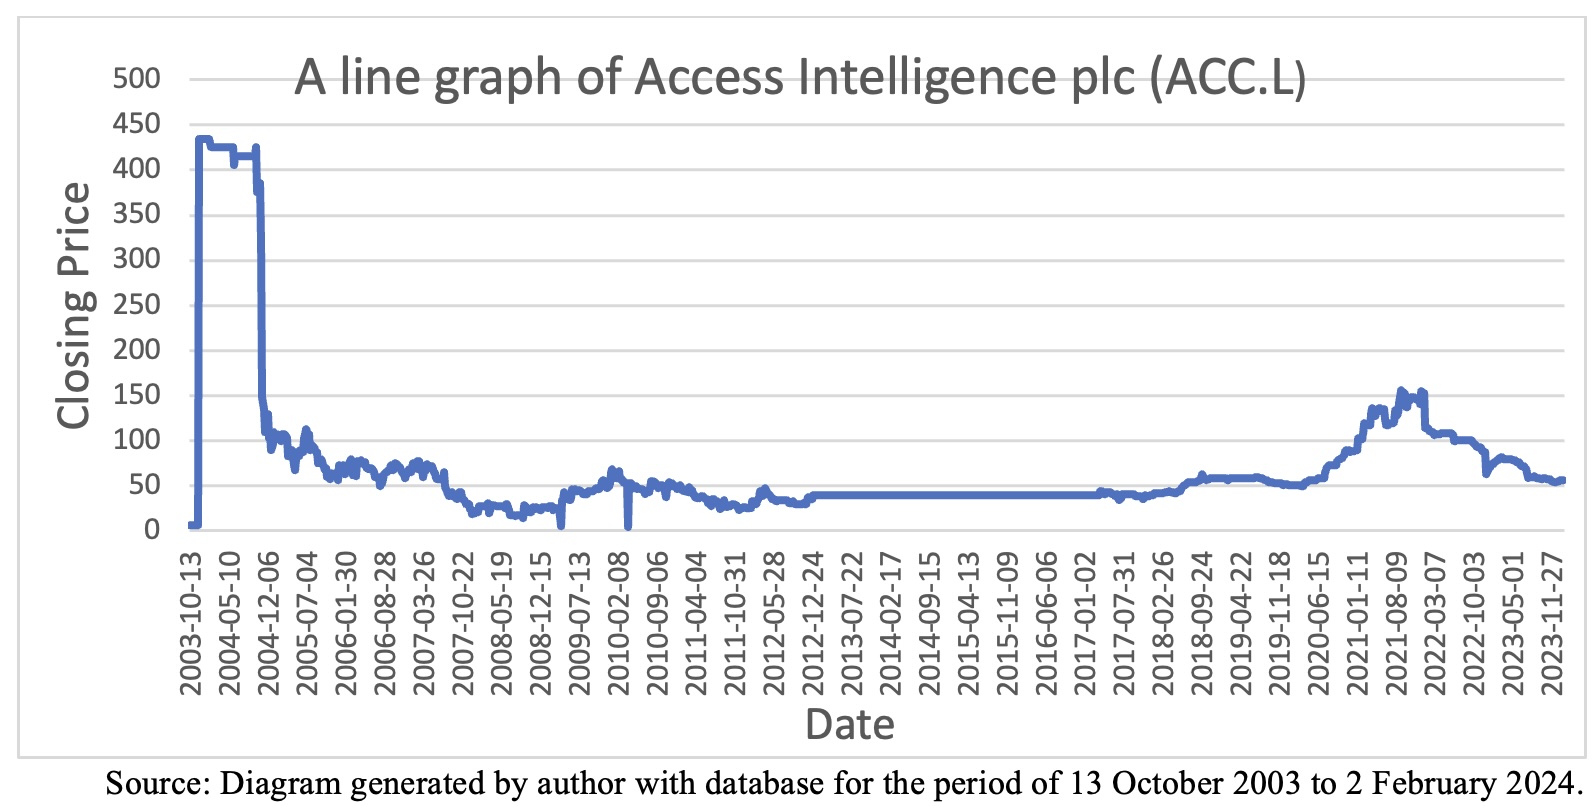
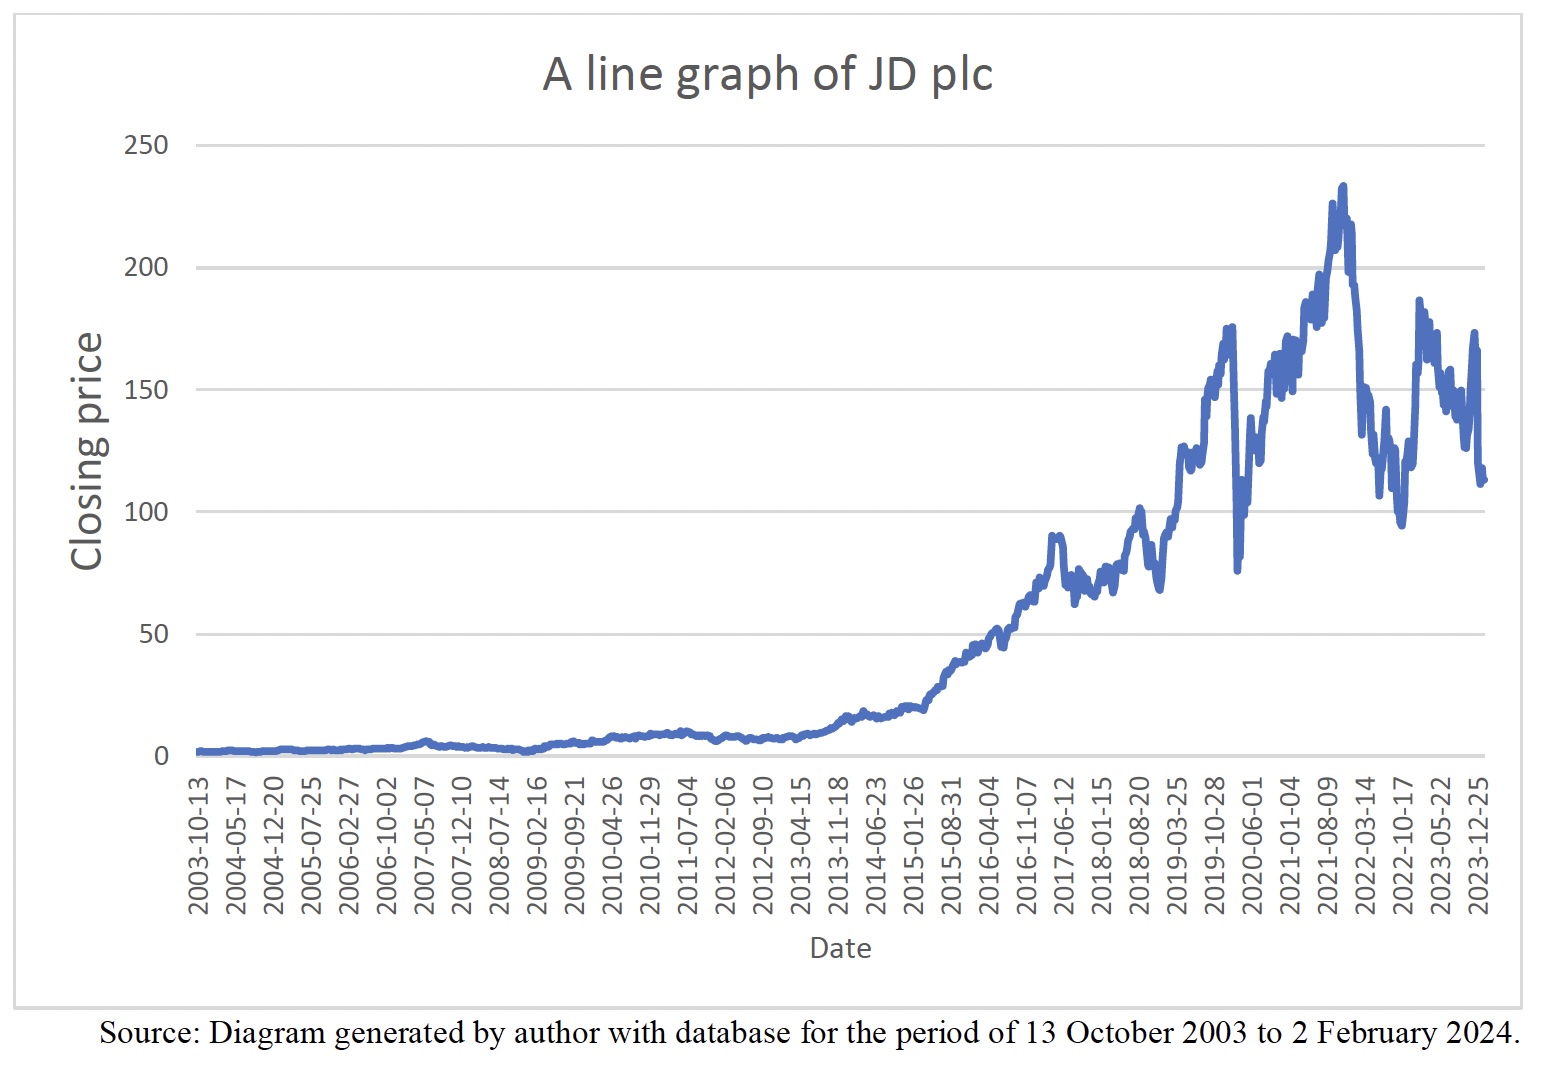
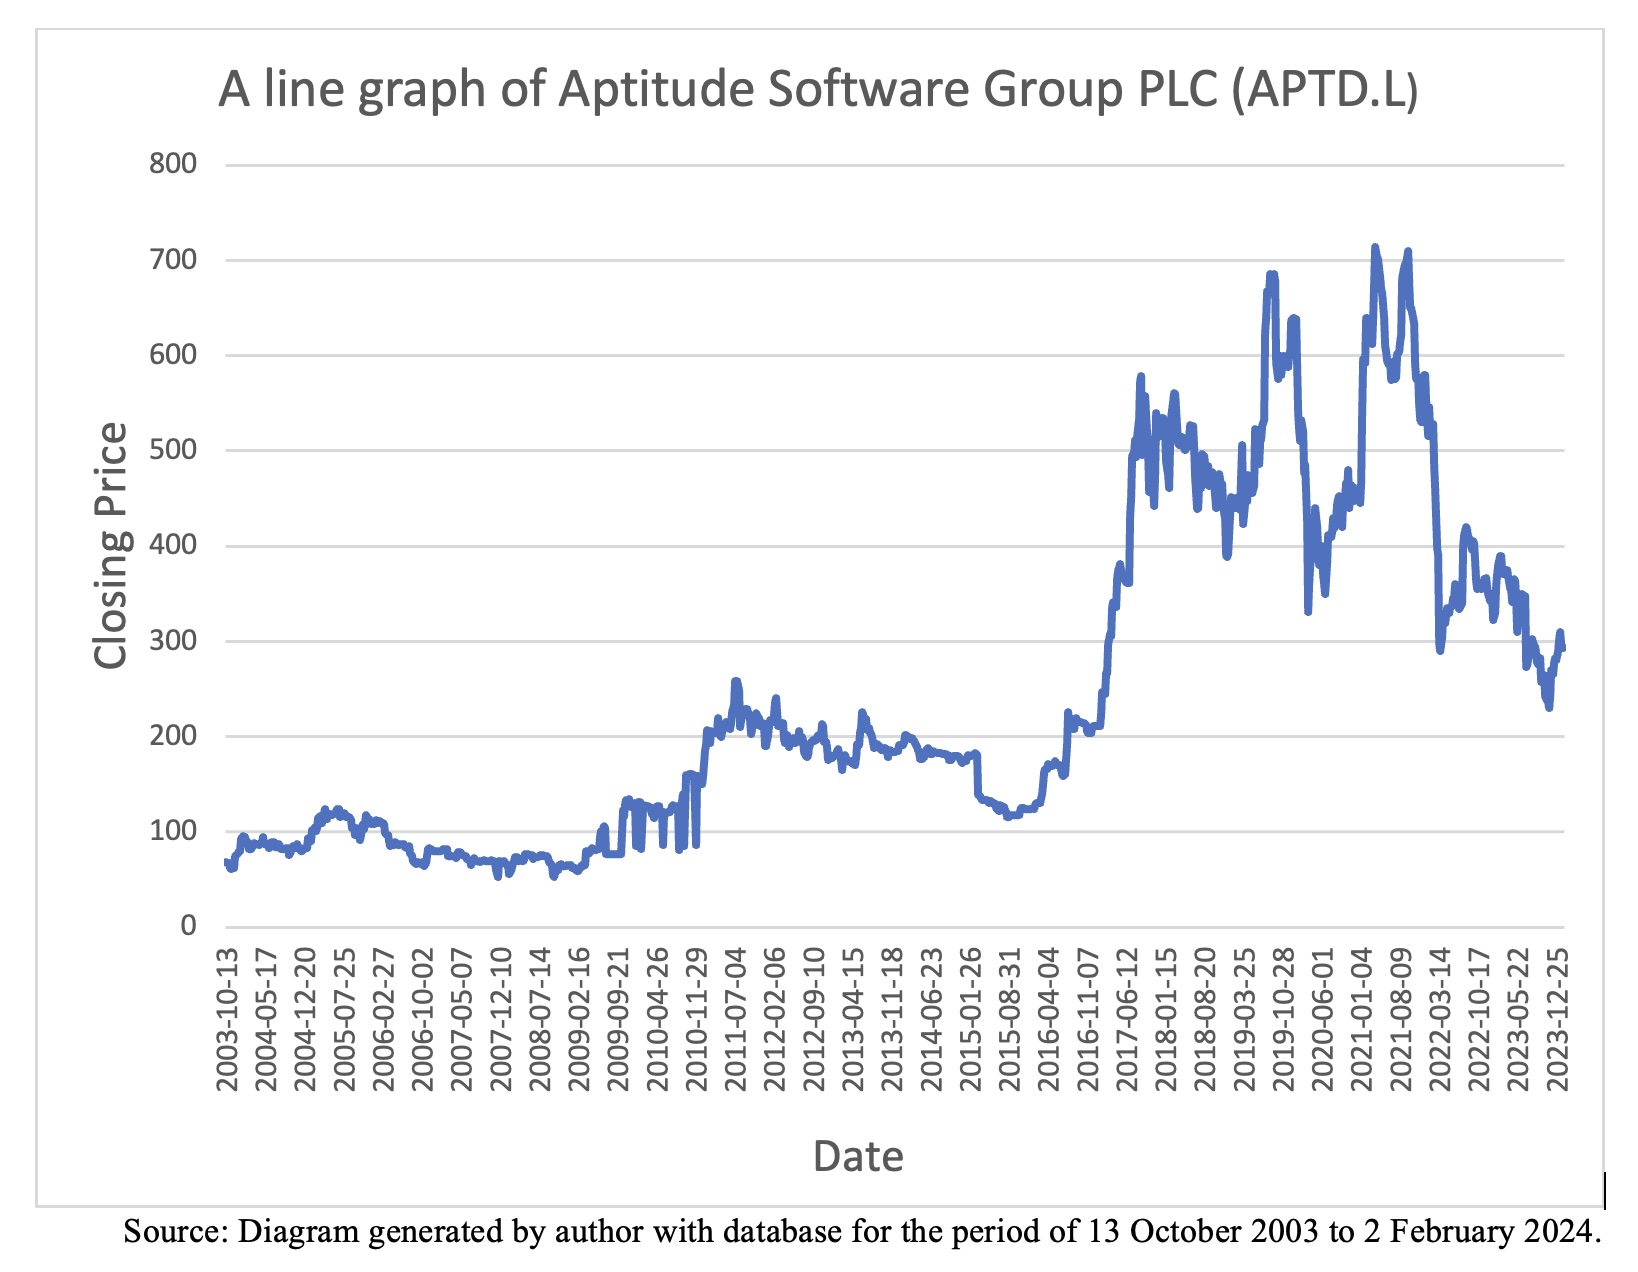
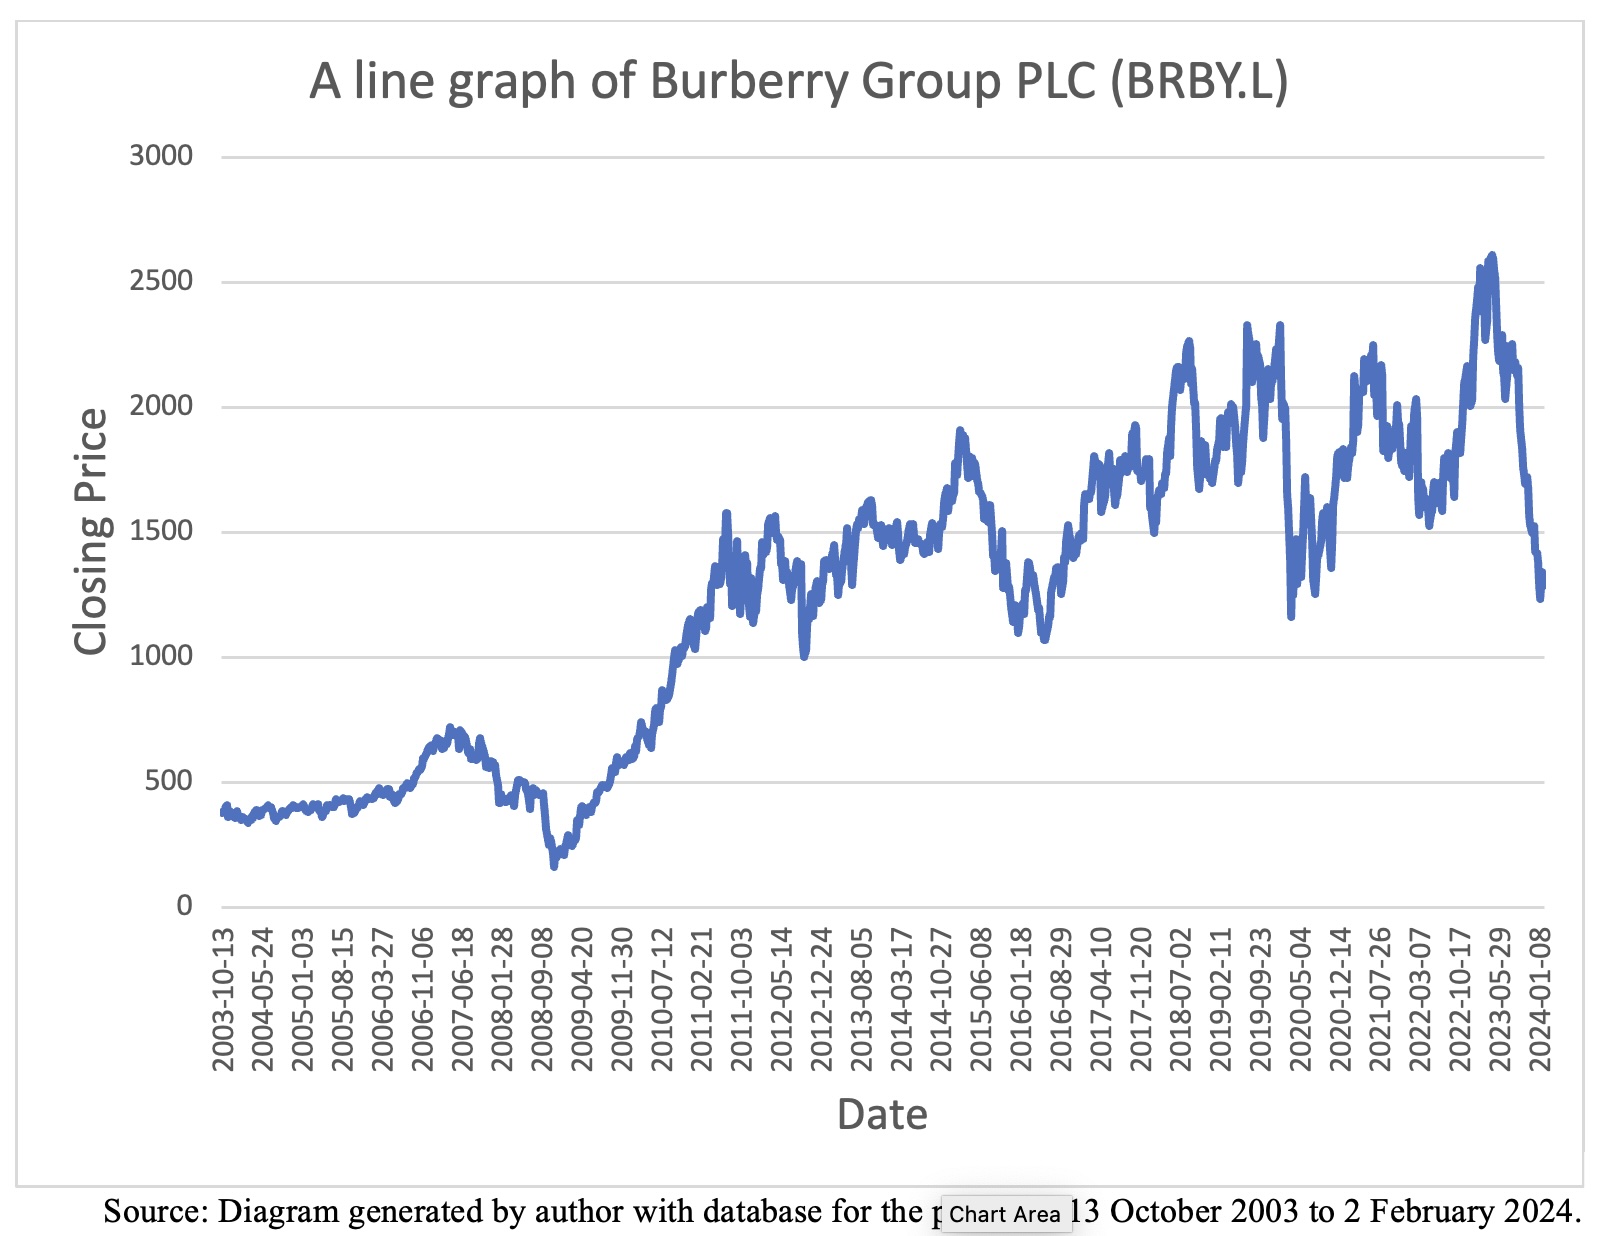
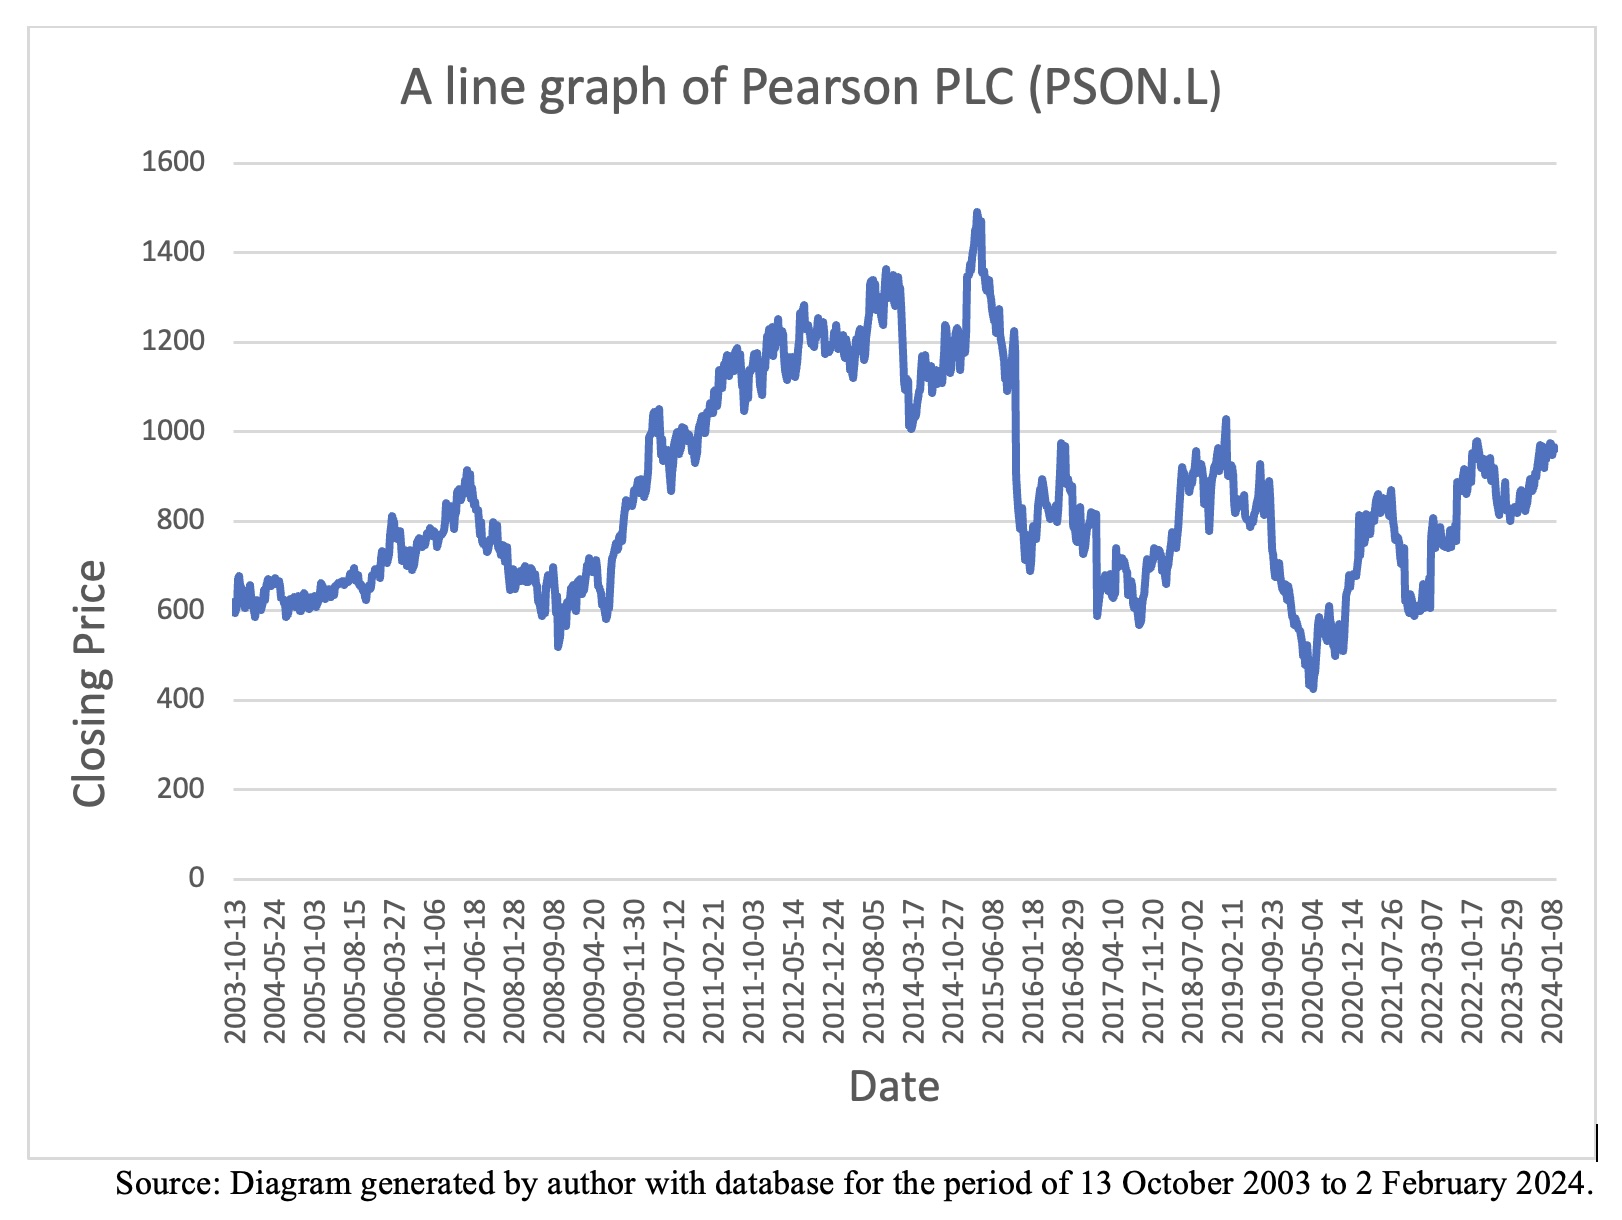
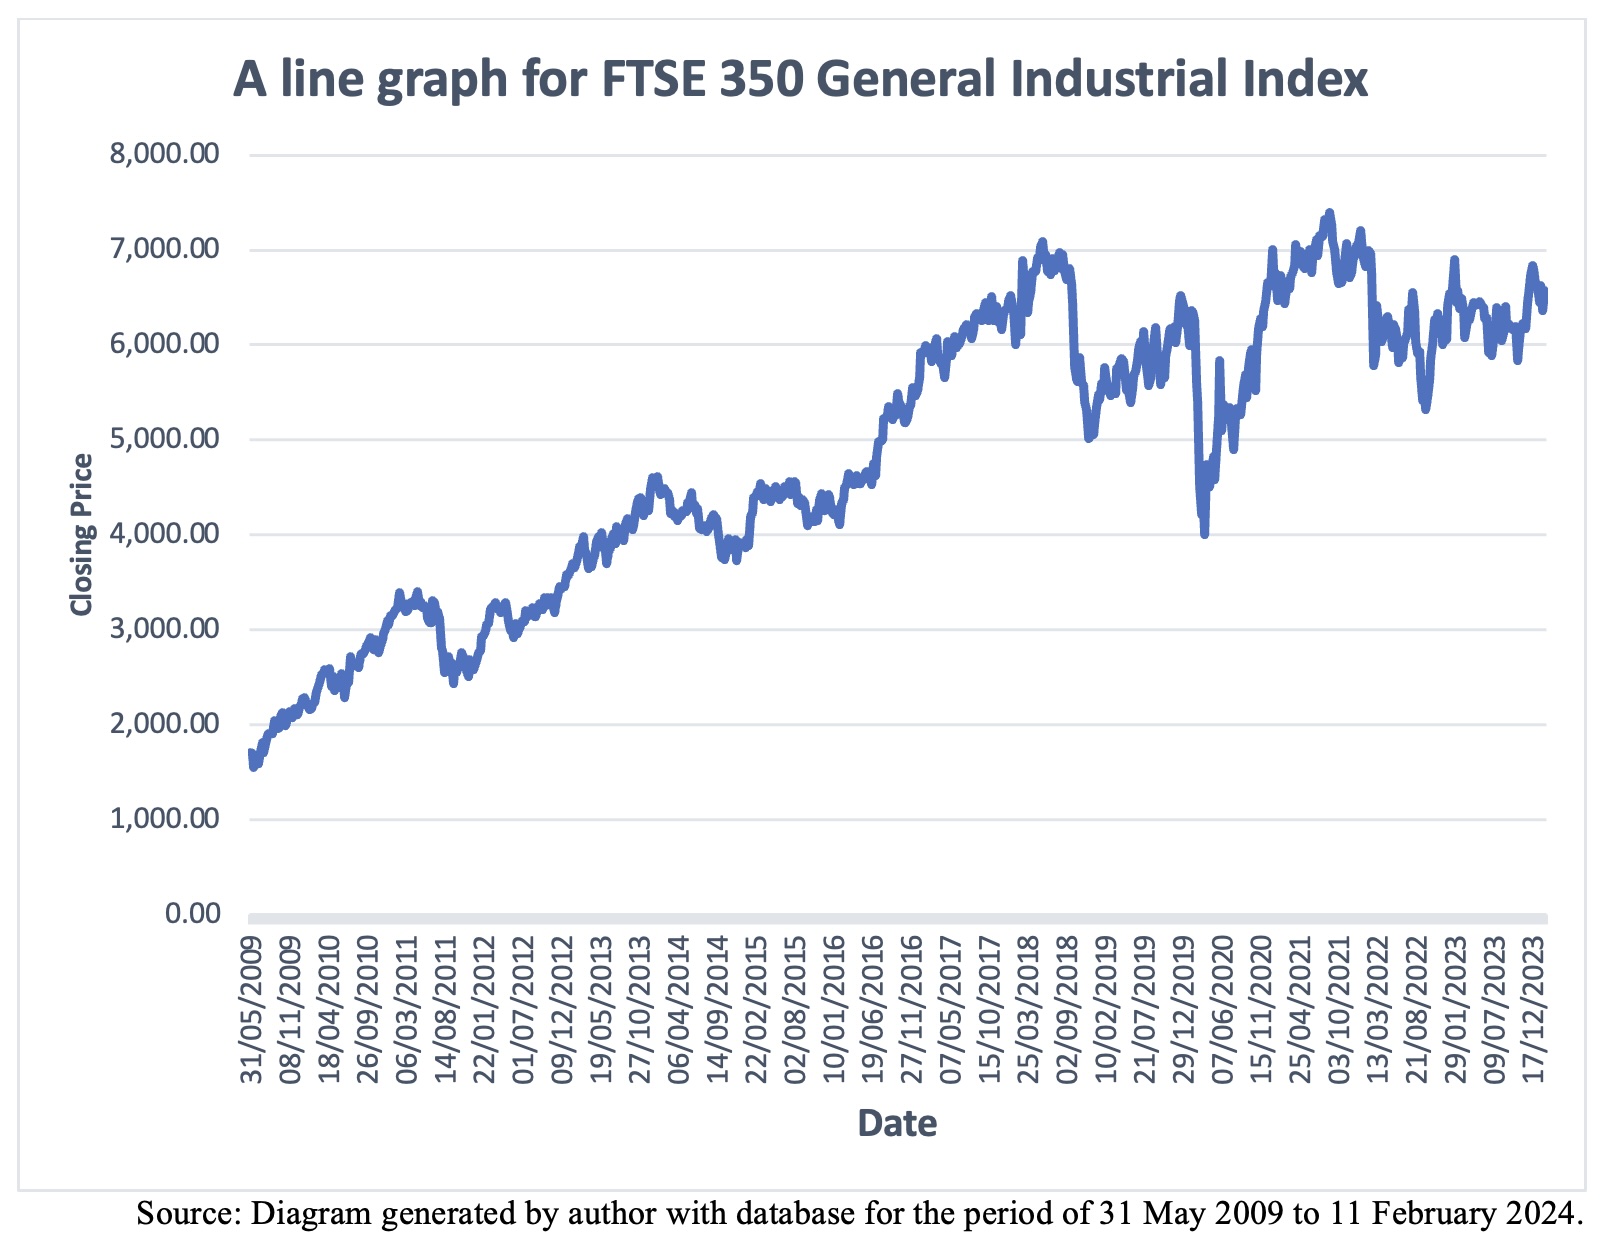
This study aims to assess the prediction power of exponential smoothing techniques critically and rigorously in the creative industry of the UK stock market. For this reason, weekly closing price data were collected from the five companies of the creative industry and FTSE-350 General Industrial Index, for the sample period from 13 October 2003 to 2 February 2024. Bai-Perron’s multiple breakpoints test of L + 1 vs. L sequentially determined breaks has been applied for the purpose of identifying plain data of sub-sample period for all selected series. The descriptive statistics table, histograms, and kernel density graphs from all series exhibit that the weekly closing prices are not normally distributed. Runs test documents that weekly closing prices of all the series do not move randomly. Additionally, variance ratio of Chow-Denning joint test evidences that all series follow a martingale model. Furthermore, LB’s serial correlation test documents that most of the series do not have serial auto-correlation at the first difference. Moreover, the Augmented Dickey Fuller – unit root test suggests none of the series have got unit root at the first difference. Consequently, the statistical inference was made that the London Stock Exchange (LSE) including the creative industry is weak-form inefficient in the period of the tests and its stock prices are predictable. Holt’s double exponential smoothing technique contributes to demonstrate better short-term forecastability of stock prices for most of the series in the creative industry and the FTSE 350 General Industrial Index. Therefore, this study does not find any support for weak-form efficiency over the periods tested in the LSE. This research extends the current literature by studying the existence of weak-form inefficiency in the creative industry.
KEYWORDS: Forecasting stock price, creative industry, exponential smoothing techniques, random walk model, structural breakpoints.